Redistricting
When the boundaries of electoral districts are intentionally manipulated (gerrymandering), to favor a certain outcome, the fundamental concept of “free and fair elections” is put into question.
GeoTuple can potentially play a role in addressing this issue (along with #UNHacktheVote efforts) by providing answers to many of the questions involved. For example, it can quantify the relationship between voting and demographic variables for any arbitrary area.
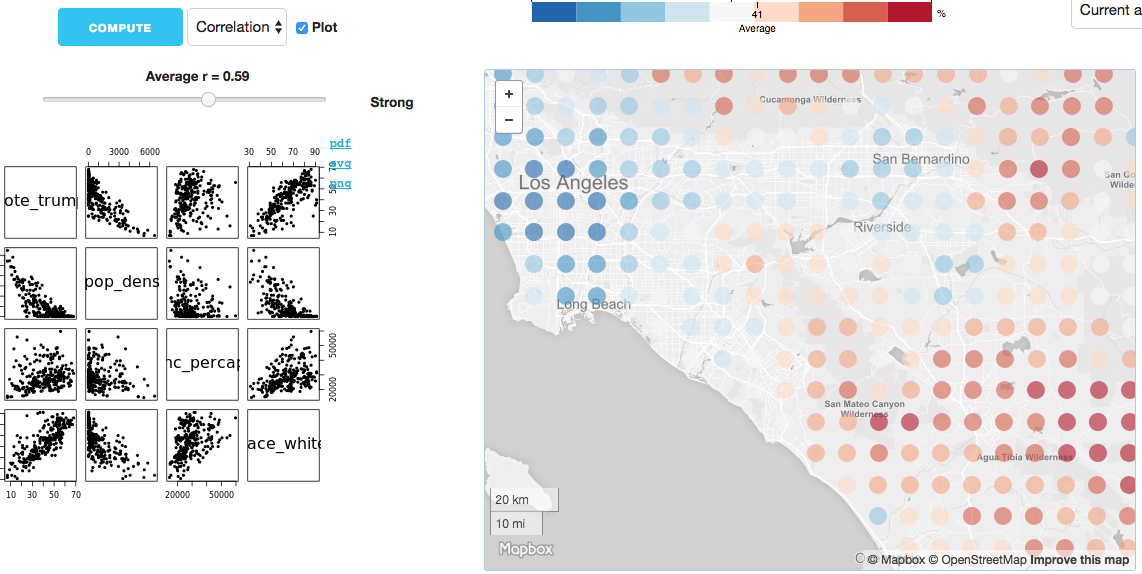
The map below suggests a strong correlation with voting for Trump and:
- population density (city vs rural)
- race (% white)
but less so for:
- income
One could imagine an app that lets the user interactively adjust district boundaries all the while giving instant feedback for relevant statistics!
Note In creating the underlying data layer: California voting precincts in TopoJSON format, I was able to simplify and compress the polygon file to a manageable 10Mb.